Data collection
Site list
In OCRIS Mobile, all data is collected against "projects" and "sites" (note: these terms can be renamed/remapped to something different, but this documentation will use the official terminology). A project is a collection of sites. Each site belongs to a single project.
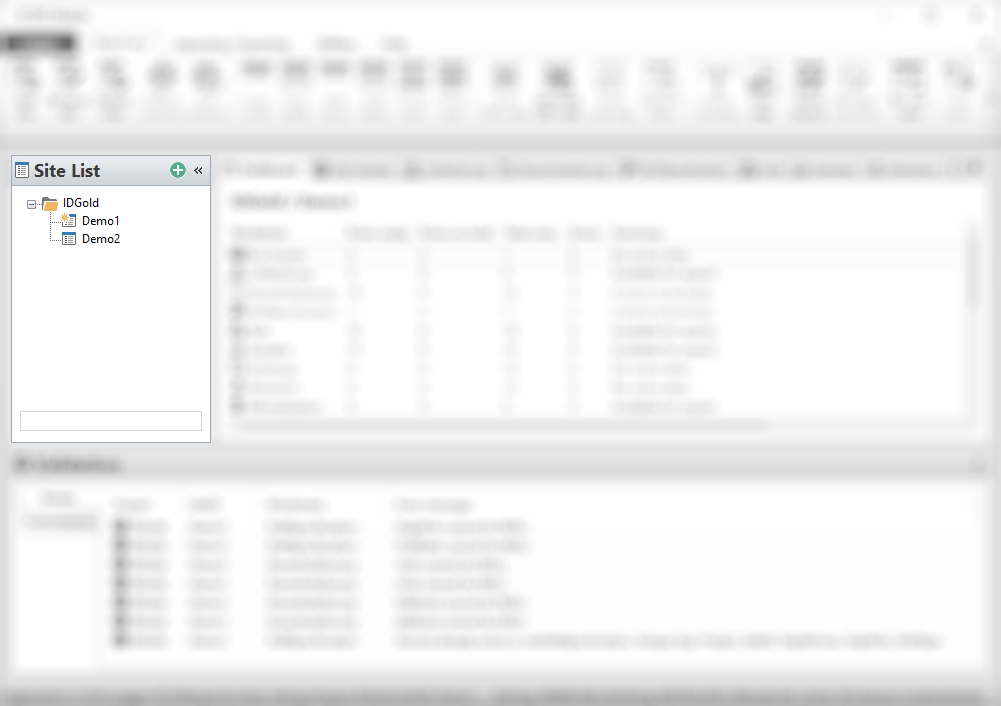
On the left of the OCRIS Mobile UI, there is a site list column. This shows a list of all projects and sites that are available within the logger.
You can select a site by left-clicking on it. The currently selected site will be marked with a star icon, and displayed on the status bar at the bottom of the application.
Creating a new site
To create a new site, click on the green "plus" icon in the top-right of the site list, or click on the Add site button on the top ribbon menu.
You will be presented with the 'Create Site' interface, allowing you to create either a single site (by specifying a project and a single site ID), or multiple sites (by specifying a project, site ID, count, and increment).
Creating a single new site
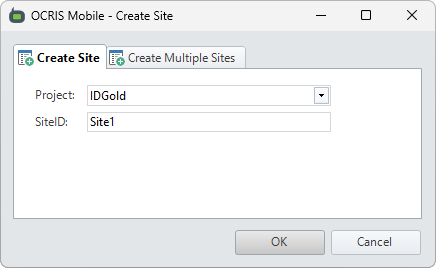
This option creates a single new site, with the specified project and the specified site ID.
Creating multiple new sites
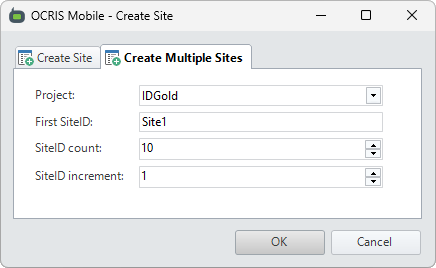
This option creates multiple new sites, with the specified project and site ID generated from the specified pattern.
For example, if you specified the first site as Site1, a count of 10, and an increment of 1, then the following sites would be generated: Site1, Site2, Site3, Site4, Site5, Site6, Site7, Site8, Site9, and Site10.
Site dashboard
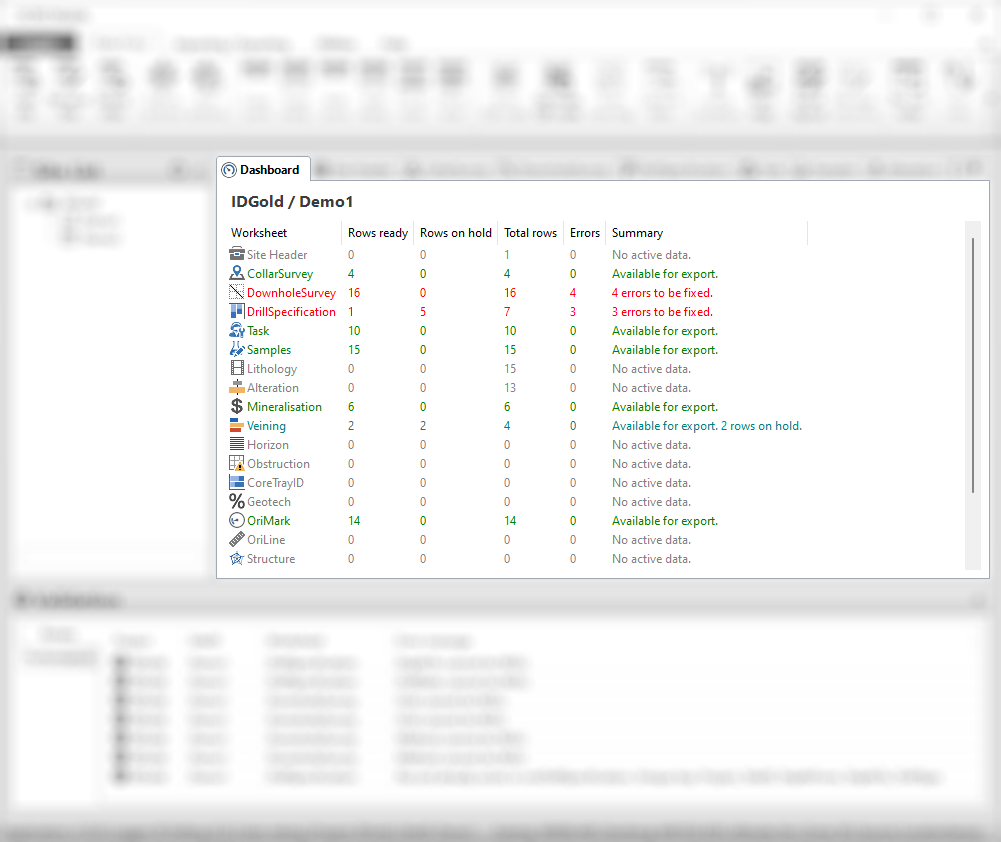
Once you have selected a site, the first tab you will see in the worksheet area is the site dashboard. The site dashboard provides an overview of all the worksheets within that site. It shows you the total number of rows in each worksheet, as well as how many of them are ready for export, and how many are on hold. It also shows the number of errors that need to be fixed.
The site dashboard is a good place to get an overview of the selected site.
The worksheet area
This section is a work-in-progress and has not been finished yet
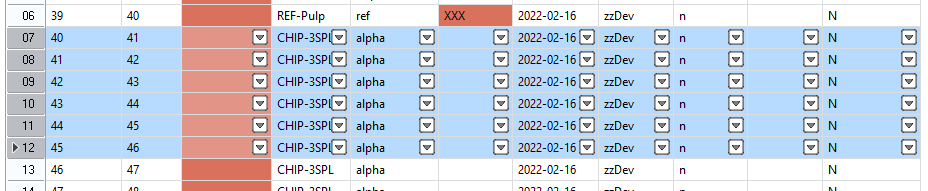
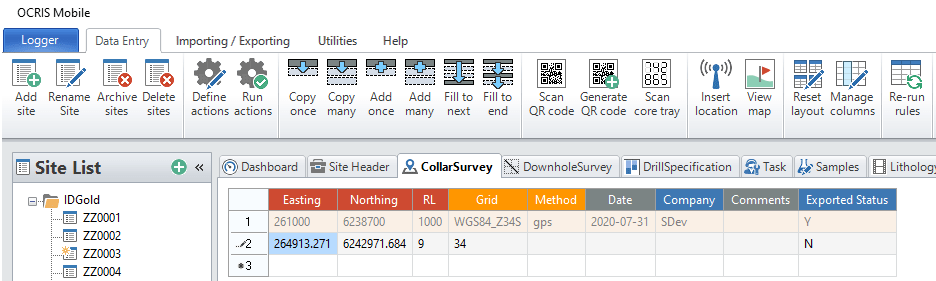
Column color-coding
Worksheet column headings are color-coded based on:
- Whether it is mandatory for cells in that column to have a value
- Whether the cell values are unrestricted, or must be selected from a pick-list
| Column header color | Mandatory | Input type |
|---|---|---|
| Red | Yes | Unrestricted |
| Orange | Yes | Pick-list |
| Blue | No | Pick-list |
| Grey | No | Unrestricted |
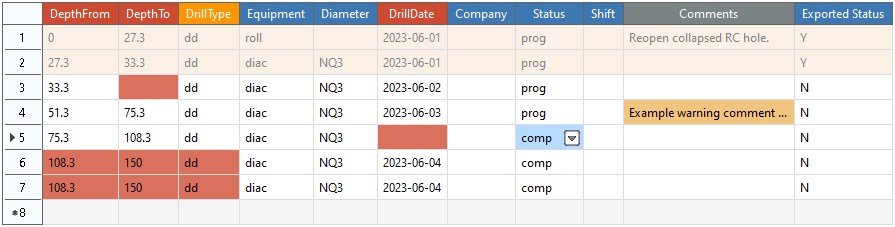
See the following example:
![]()
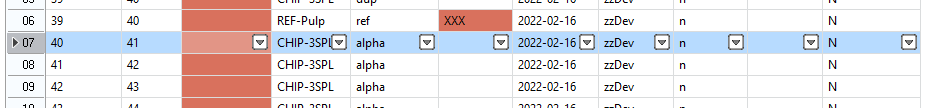
Cell color-coding
Cell values are color coded based on:
- The export status of the cell.
- The validation status of the cell.
- Whether the cell is selected or not.
| Cell color | Description |
|---|---|
| White | An active cell that has no validation errors. |
| Yellow / Orange | An active cell that has one or more validation warnings. |
| Red | An active cell that has one or more validation errors. |
| Blue | An active cell that is currently selected. |
| Tan / Beige | A cell that has already been exported, and now can no longer be edited. |
See the following example:
Worksheet Actions
OCRIS Mobile supports setting up Actions that will populate cells in new rows. This is particularly useful when entering repetitive data such as Samples or Lithology units. Worksheet Actions are set up by an individual user within a Logger and a number of Actions can be saved into a group. It is then possible to select an individual Action or a Group of Actions and run it multiple times to speed up the data entry process. Once the data has been entered it is possible to edit individual rows or cells.
Define Actions
To set up Worksheet Actions click on the Define Actions icon in the Ribbon 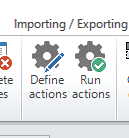
New Action
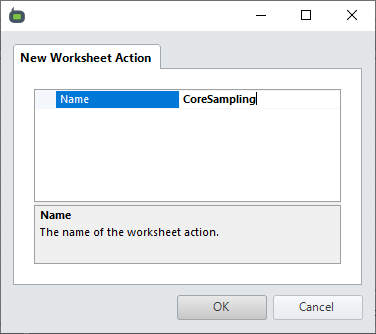
To create a new Worksheet Action click on the Green Plus icon in the form and define what data will go into each cell when a new row is added.
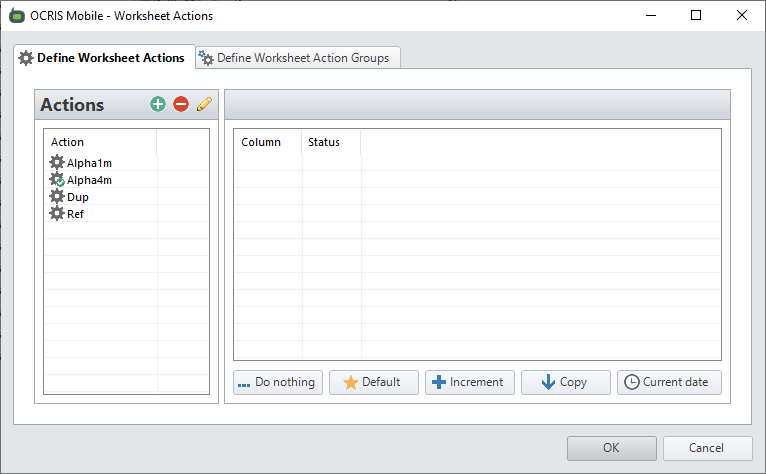
Give the Action a meaningful name that describes what data will be created and click OK.
Click on the Column in the right hand panel and select what you want the cell to be populated with.
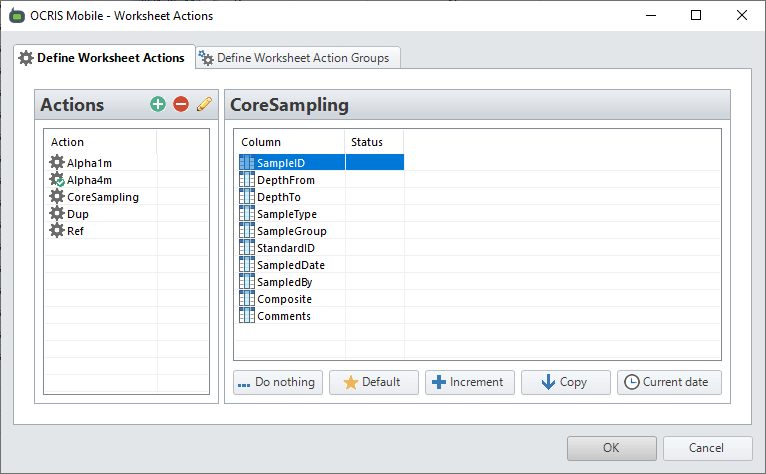
Each action is described below;
![]() Do Nothing - Ignore this cell
Do Nothing - Ignore this cell
![]() Default - Type in a default value for this field
Default - Type in a default value for this field
![]() Increment - increment the value from the row above into the cell. This can be positive or negative values
Increment - increment the value from the row above into the cell. This can be positive or negative values
![]() Copy - Copy the data from a cell in the row above. This cell can be any on the row. A good example of this is copy down the previous Depth To into the new Depth From.
Copy - Copy the data from a cell in the row above. This cell can be any on the row. A good example of this is copy down the previous Depth To into the new Depth From.
![]() Current Date - Enters the current date
Current Date - Enters the current date
Work through each column to define what action you want to take when a new row is created.
To change the properties of any Action that has been defined, right click on the saved Action in the left hand panel to initialise the options.
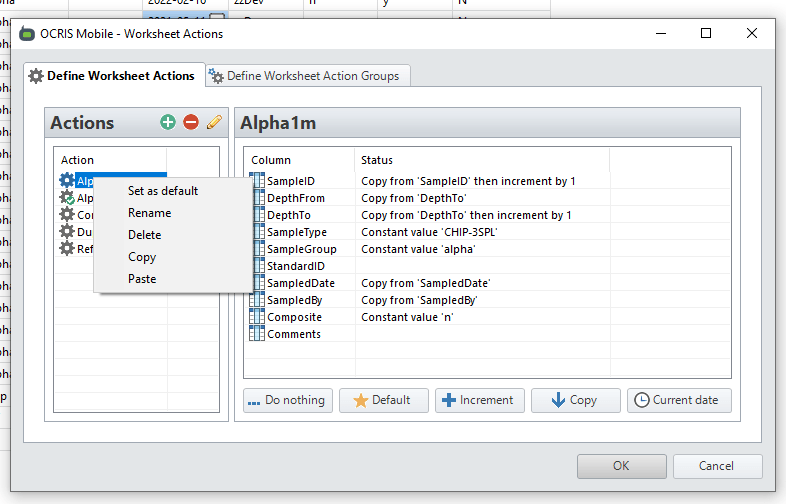
Set as Default - Will use this Action for each new record. Please note that you may need to fill in some starter values from which the next row will spawn. For example the SampleID and Depth range. Any columns that have had a Default value set will be automatically populated with that data.
Rename - Renames the Action
Delete - Deletes the action, it will no longer be available to choose
Copy - Copies all the settings from the selected Action
Paste - Pastes the settings into a new Action which can then be modified and renamed as appropriate
New Action Group
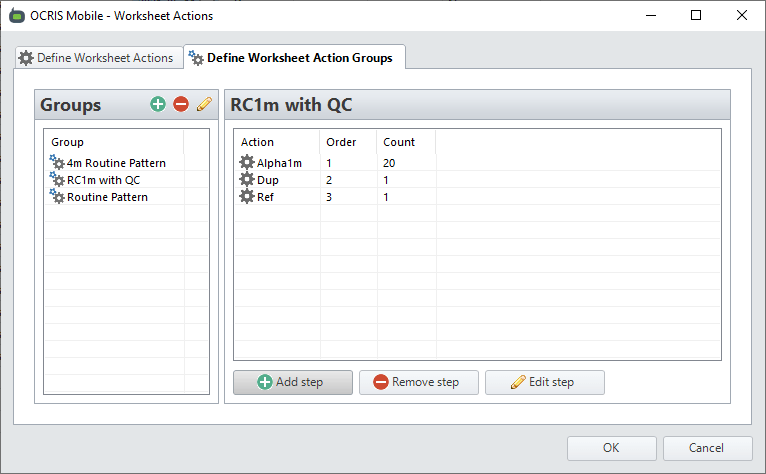
To create a group of Actions that can be run together click on the Define Worksheet Action Groups tab on the OCRIS Mobile - Worksheets Actions form.
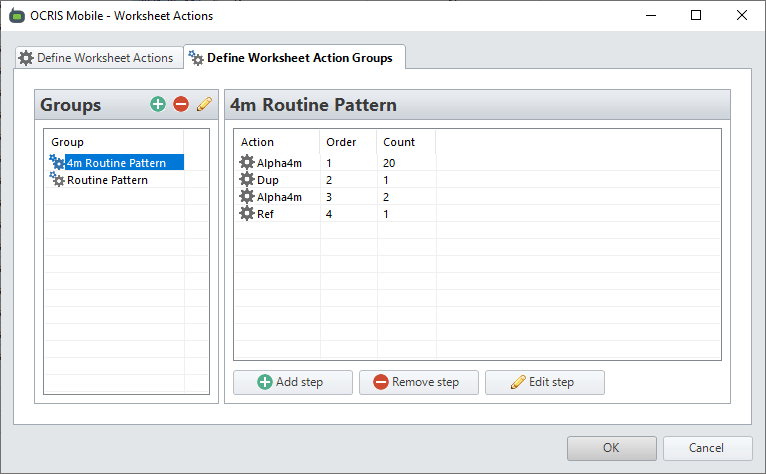
To add a new Group of Actions click on the green plus icon, give the Group a meaningful name and click OK.

To add individual Actions into the Group click on Add Step and select the appropriate Action. Define the order that you want to run the step and how many times you want it to run. Click OK to save the step.
Continue to add Steps until your pattern has been defined. Click OK to close the form.
Using Actions for Data Entry
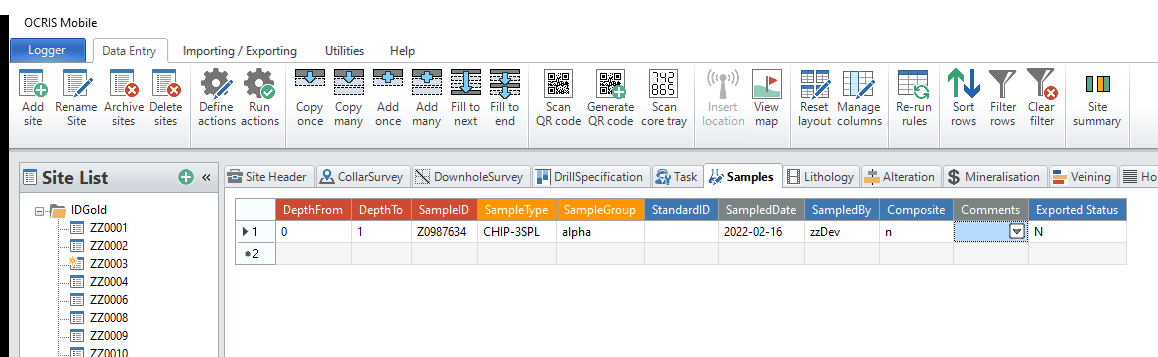
To use the Worksheet actions to add data to the data grid click on a new row. If an Action has been set as Constant then any values that have been defined as Default in the Action will be automatically entered.
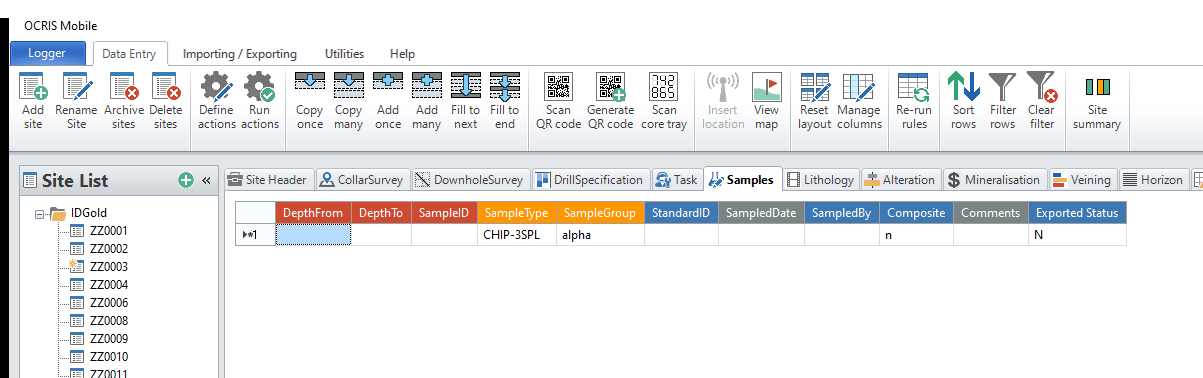
You then need to fill in the variable results to complete the row.
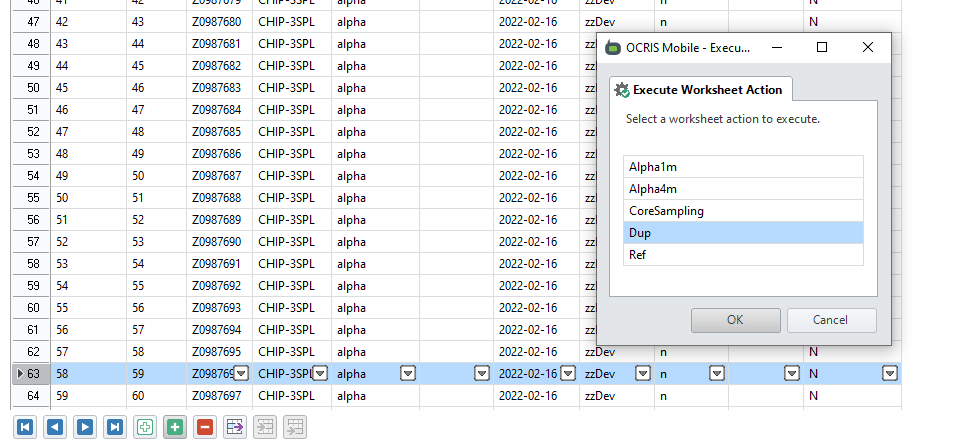
To enter multiple rows via the Worksheet Actions click on the Run Actions icon on the Ribbon and chose one or more Actions to run or a Group of Actions to run and define the Count and Order to run the actions. OCRIS Mobile will show how many rows will be added once you click OK.
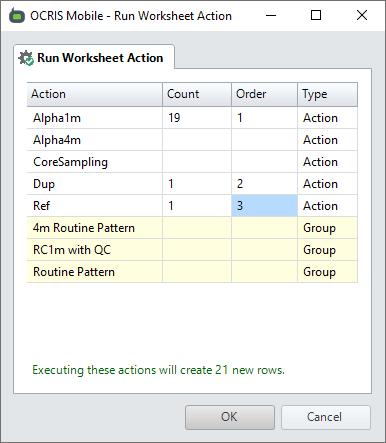
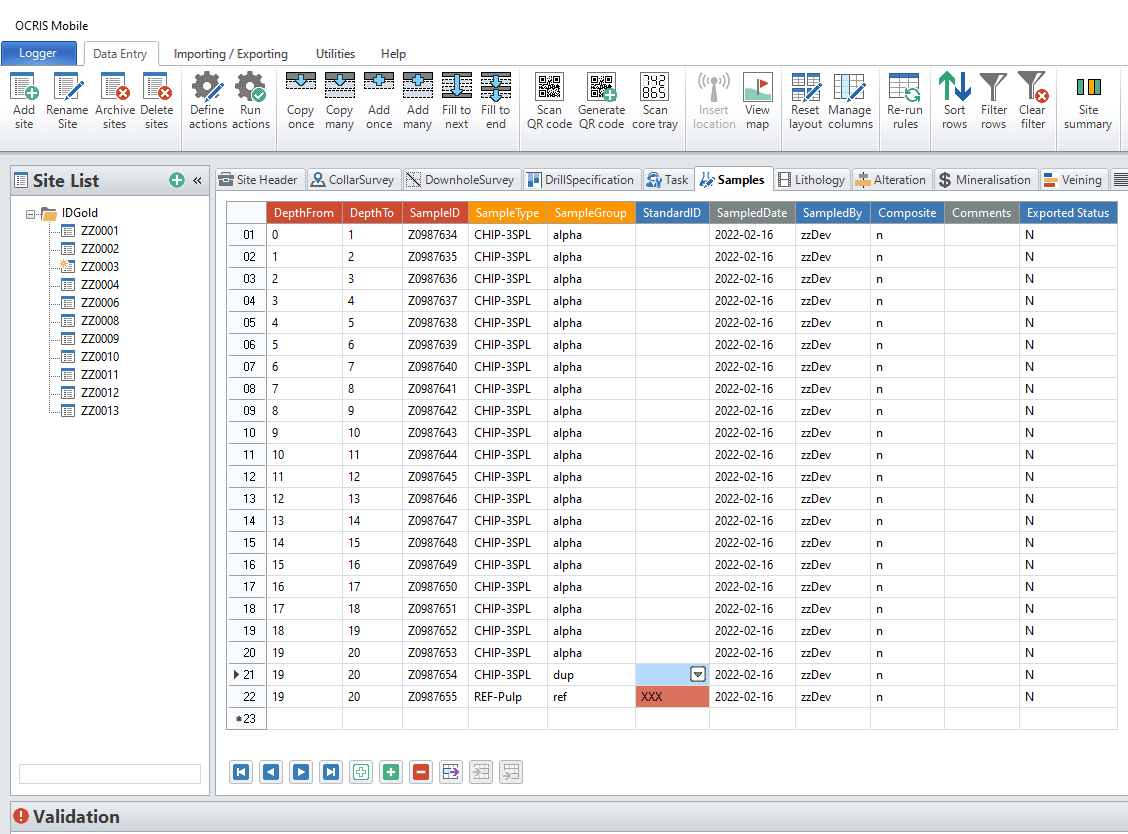
OCRIS Mobile will then perform the task and add rows to the Worksheet. Please note, it is possible to edit any of the data that has been added via this process. For example, you might need to add the StandardID to the QC row if this was not set as a Constant.
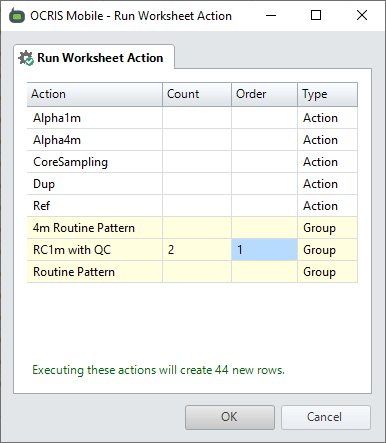
You can also select a Group or Groups of Actions to run, define how many times and in what order to run. OCRIS Mobile shows how many rows will be added once you click the OK button to execute the data entry.
Inserting Rows
If you have completed multiple rows but then need to add an additional row into the stack click on the White plus to add an empty row below the current row and then fill in the required data.
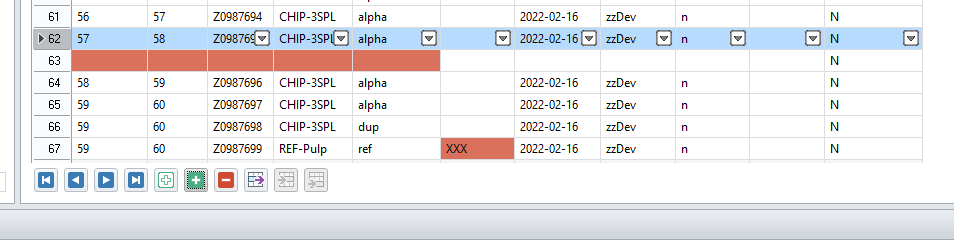
To add a Row using a saved Worksheet Action click on the Green plus and select which Action you want to use, click ok to add the row. This is particularly useful if you have inserted QC samples after data entry of the original samples.
Copy Rows
To copy an entire row or rows of data, highlight the data and either CTRL + C or click on the Copy icon ![]() at the bottom of the Worksheet.
at the bottom of the Worksheet.
Paste Rows
To paste the row click CTRL + V and chose if you want the row inserted on the row beneath the copied row or at the bottom of the worksheet.
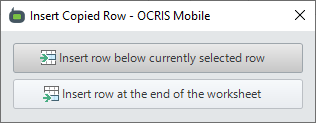
ALternatively, click on the Paste rows from clipboard (below current row) ![]() or Paste rows from clipboard (at end of worksheet)
or Paste rows from clipboard (at end of worksheet) ![]()
Data Entry Shortcuts
In OCRIS Mobile it is possible to do data entry by columns as well as rows. This functionality is particularly useful for speeding up geology logging; enter the intervals first then add attributes in the cells at the depth they change. Then either select the Copy or Fill functions to fill in the gaps.
Initial Population
In the screenshot below you can see that the intervals have been populated and then where the various attributes change.
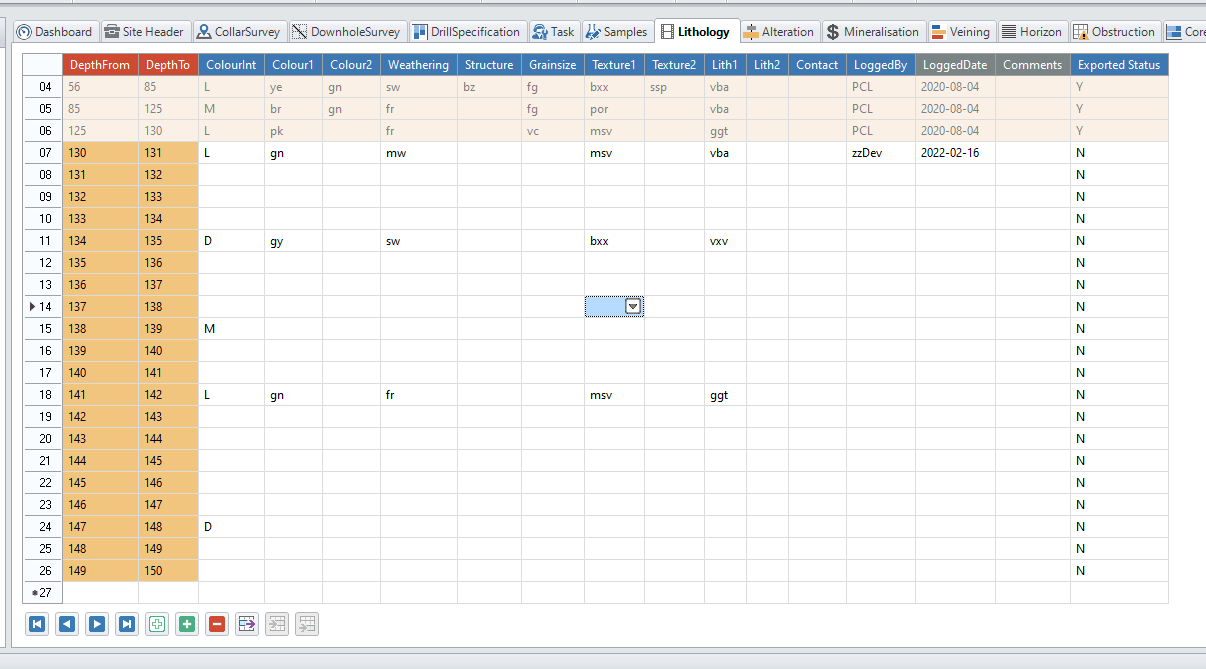
In the screenshot below the grid has been partially completed using the data entry shortcuts.
Copy Once
The ColourInt column was copied down using the Copy Once function ![]() . If you select the Copy many button you will be prompted to enter how may rows you want to populate.
. If you select the Copy many button you will be prompted to enter how may rows you want to populate.
Fill to Next
The Colour1 column was filled in using the Fill to next fuction ![]() . OCRIS Mobile copies down the data until it reaches a populated cell.
. OCRIS Mobile copies down the data until it reaches a populated cell.
Fill to End
The Weathering column was filled in using the Fill to end function ![]() . OCRIS Mobile copies down the data until it reaches a populated cell and then changes to that value down until the next change. This continues to the bottom of the worksheet.
. OCRIS Mobile copies down the data until it reaches a populated cell and then changes to that value down until the next change. This continues to the bottom of the worksheet.
Adding Data
Sometimes depth data are entered before other, related data such as SampleID in a Sampling sheet. To complete the data such as an incrementing SampleID use the Add once ![]() or Add many
or Add many ![]() function.
function.
Add once will increment the value in the active cell by 1 into the cell below.
Add many will prompt you to chose how many rows to populate and the increment to apply.
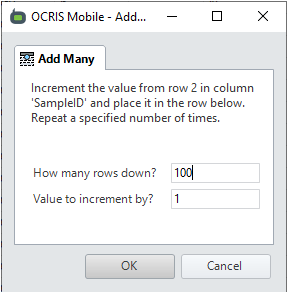
If you want to dd Many to the end of the worksheet chose a large number. OCRIS Mobile will not add rows beyond the last existing record with this function.
Mapping and Location options
The following mapping and location options are available:
Insert location
OCRIS Mobile supports the use of GPS to enter coordinates. It is possible to use in-built or external GPS connected via Bluetooth or USB. Before using this function check in the computers Device Manager to check if a GPS is available.
The Worksheet/s that will utilise GPS has been configured by your system administrator and OCRIS Mobile will automatically enable the functionality when you have selected the appropriate Worksheet. OCRIS Mobile will check if a GPS is available and will display the status in the bottom right hand side of the app.
If no GPS is available it will display GPS: Searching for sensor...:
![]()
If a GPS is connected and OCRIS Mobile is searching for a valid input string it will display GPS: Waiting for data...:
![]()
When valid GPS data is available it will display the coordinates and zone:
![]()
To retrieve your location data from the GPS, select the correct worksheet, typically Collar Survey or Point Sampling, select the row and click on the Insert location button.
OCRIS Mobile will write the current coordinates into the relevant cells on the row.
You may need to add additional or utilise a Worksheet Action to add default values to cells.
View map
It is possible to view the location of data in OCRIS Mobile relative to other data points via a basic map interface.
To see where the data lies, click on the View map button.
OCRIS Mobile will open a form that displays the location of all Sites in the designated worksheet that was set by the System Administrator.
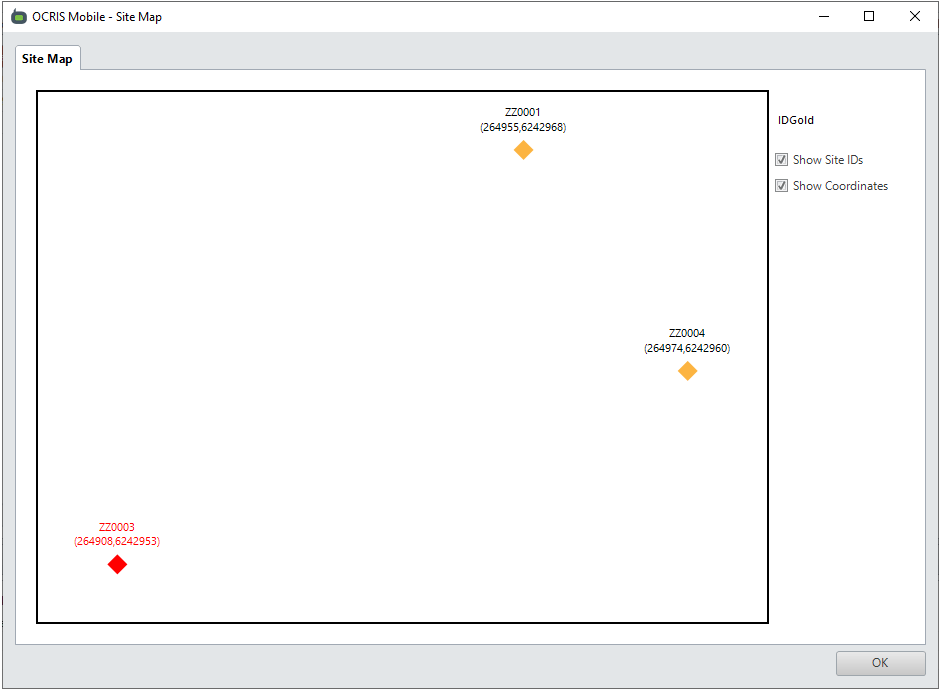
Please note: This is a very somewhat interface at the moment. More coming soon.
Layout options
The following layout options are available:
Reset layout
OCRIS Mobiles allows the tabs in the worksheet area to rearranged and reordered by dragging and snapping them.
You can click on the Reset layout button to reset the customized layout back to its default state.
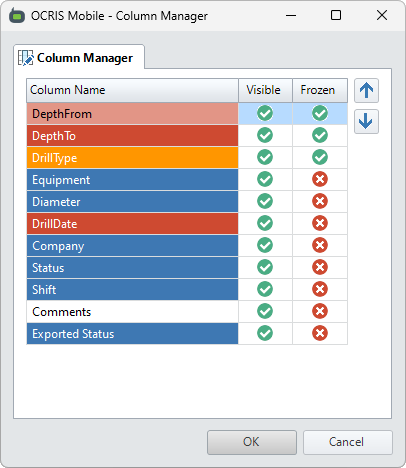
Manage columns
You can click on the Manage columns button to open up the column management UI. This allows you to do the following:
- Change the display order of the columns by selecting a column and using the up or down buttons to re-order it.
- Show or hide a column by toggling its value in the 'Visible' section.
- Lock a column (or a group of columns) to the left side of the grid by toggling its value in the 'Frozen' section.
Re-run rules
Users can click on the Re-run rules button to trigger a manual refresh and re-run of all of the OCRIS Mobile validation rules that apply to the logger.
This is generally not needed in usual operation of the software, but the administrator may have designed some custom rules which require this button to be pressed on occasion.
Row sorting and filtering
The 'row sorting and filtering' menu offers 4 options:
Sort rows
Users can click on the Sort rows button to bring up an interface that allows them to sort the rows in the current grid.
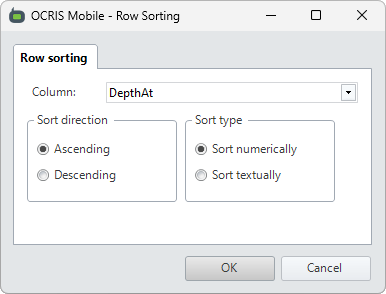
The following options can be set:
- Column - The column that the rows will be sorted by.
- Sort direction - Controls whether the rows will be sorted in ascending or descending order.
- Sort type - Controls whether rows will be sorted numerically or textually.
Remove sort
Users can click on the Remove sort button to remove any sorting that has been applied to the current grid via the Sort rows option, and revert the grid to its default state.
Filter rows
Users can click on the Filter rows button to bring up an interface that allows them to set a filter for the rows in the current grid.
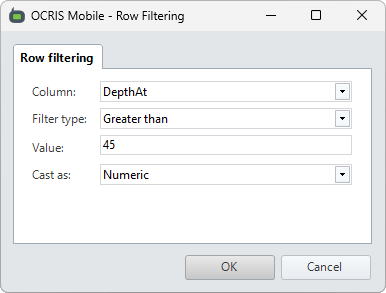
The following options can be set:
- Column - The column containing the value to filter the rows on.
- Filter type - The type of filter to apply (see below).
- Value - The comparison value in the filter. Can use
%as a wildcard inLikeandNot likefilters. - Cast as - Controls whether values will be cast as text or as numeric values.
The following filter types are available:
- Equals - Show all rows with values that are equal to the filter value.
- Not equals - Show all rows with values that are not equal to the filter value.
- Like - Show all rows with values that match the filter's LIKE expression.
- Not like - Show all rows with values that don't match the filter's LIKE expression.
- Less than - Show all rows with values that are less than the filter value.
- Less than or equal to - Show all rows with values that are less than or equal to the filter value.
- Greater than - Show all rows with values that are greater than the filter value.
- Greater than or equal to - Show all rows with values that are greater than or equal to the filter value.
Clear filter
Users can click on the Clear filter button to clear any filtering that has been applied to the current grid via the Filter rows option, and revert the grid to its default state.
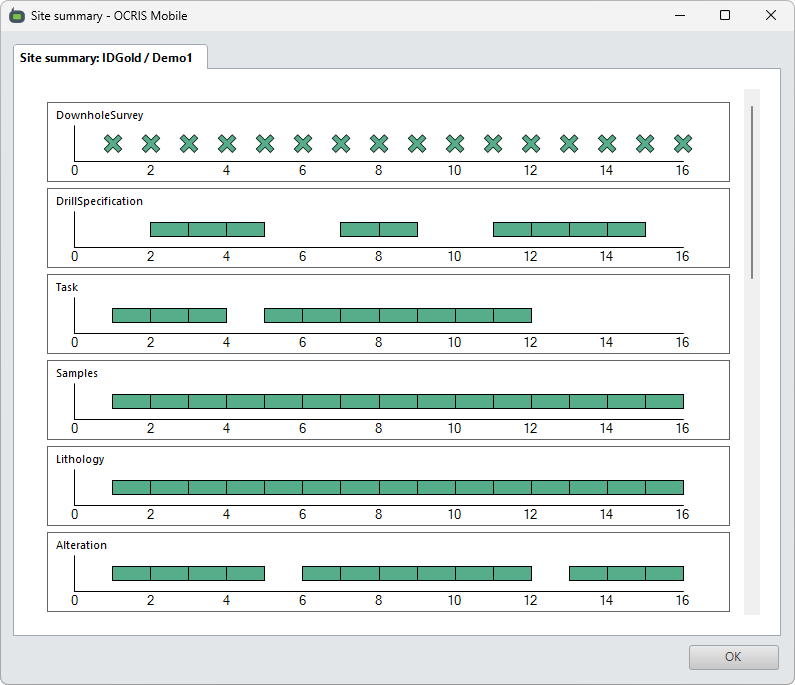
Site summary
Users can click on the Site summary button to view the site summary UI, which shows a visual overview of the current site and all its worksheets.
This allows you to easily visualize the data that has been collected, and visually identify any missing data, gaps in holes, etc.
Change tracker
OCRIS Mobile has a built-in change tracker that will track the 100 most recent edits made to the data grid.
While users are working in the data grid, they can press the CTRL+Z hotkey to instantly undo the most recent change.
Users can also click on the Change tracker button to view the edits. They can revert edits in this UI by checking the box next to the edits that they want to revert, and then clicking on the Revert selected changes button.
![]()
Deleting data
Data that has not been exported to an OXO file can be deleted from a Worksheet. It is possible to delete one or more entire rows, individual cells or a block of cells. The row or rows that will be deleted are highlighted in a light blue colour.
To delete a single row, click inside the number column on the left of the worksheet on the row to be deleted and hit the DEL key or the red minus button on the bottom of the worksheet.
To delete mulitple contiguous rows of data, select the desired rows by clicking on the row in the numbered column on the left of worksheet, hold down the SHIFT key and select the last row and hit the DEL key. All rows selected will be deleted. Please note: the red minus button will only delete the last row selected, not the entire block.